近期经济观察

Credibility Affects How the Market Reacts

Preliminary: 货币政策 & 财政政策宽松,刺激经济短期,带来短期需求增加。M2 increases results in CPI increases. 但是:

  • 1. 长期随着价格水平增加,output会回到 Y^*.
  • 2. Inflation is nothing but a monetary phenomenon. Too much money chases too few goods and services, and then there would be inflation. 当货币超发,中期, Goods & Services的增加不足以匹配超发的货币时,通胀就产生了。
  • P.S. 中期与否,取决于市场对资金的需求。Unrealistic Case 1:若为长期,人们仍然预期,未来的goods n services足以匹配过多的money,可能也不会带来Price Level的增加(“Technological Growth” Case)。Unrealistic Case 2:也可能短期,甚至超短期,Private Sectors 嫉妒悲观,不相信任何public sector’s credibility,不吸纳任何money,不用任何moeny去买goods & service,哪怕有helicopter drops。那么此时,print money means create inflation directly,印钱会在超短期就带来通胀!

Based on the previous assumption: One factor that affects how the market reacts to QE is the Credibility of the Public Section.

Where the Credibility comes from? It’s from the Stability of a State, People’s expectations about future development, Demographic Structure, Gov’s Leverage Rate and Implicit Leverage rate, and so on. Because the Public sector can do Ponzi, and renew their debts indefinitely.

After Inflation

We assume that the public sector is credible and would not default, and the stability and social structures are still healthy. Then, QE result in too much money chasing too few goods & services, and inflation emerges.

After the inflation, how do people react?

  • 1. Pour money into the Heavy-capitalised assets, such as real estate and ‘equity’ shares. Then Asset Price increases to absorb extra money. The advantage is that goods and services (necessities) might not appreciate a lot. The disadvantage is that asset price increase is still not a healthy phenomenon, and systematic troubles accumulate because the bubble collapses one day. If the Bubble Collapses, the CB must reduce liquidity (money). Let’s move case 2 then.
  • 2. QT. However, QT might be too dangerous, because high financial costs would increase financial burdens for highly leveraged households and firms. Defaults and Disposal Sales increase. Asset’s price slips. The current financial markets are highly securitised and synthetic. A decrease in core assets would result in a series of dangerous chain reactions. Potential Systematic Risks come true.
  • 3. Technological Growth brings extra demands or something else, to absorb extra money.
  • 3. However, Technological Growth might be ambiguous, and is highly unlikely to happen, at least in the current situation. It is only a potential solution and is less likely to happen.
  • If case 3 not working, we have to move back to case 2.
  • Withdraw Liquidity (money), and kill inflation. Asset Prices, such as housing prices and stock prices, evaporate. In this case, necessities’ prices are less likely to be affected because they are rigid. Housing Price is a large component of the CPI basket, reducing the price of assets might be a possibility to reduce inflation. However, the gov might choose to keep a relatively sustainable and stable recession by maintaining the housing price. House has a special function, living. So, killing the equity market, in which stock prices are not that directly linked with household living, might be the best choice for the gov.

The first case might be more effective because problems are left to future generations.

中国市场

Not in the same economic cycle as the U.S. market. There could be a reverse in the short term and even in the mid-term because the pandemic policies are forced to be stopped. However, I don’t have a positive expectation toward the market in the long run for mainly two reasons. 1. leverage increase in the local government. 2. credibility decreases. Those two reasons interact to make the problem even more severe.
Thinking about ML

Learning from Deep Learning from Scratch. Let’s me share some thinking and ideas.

  • 1. Neural Network, multi-layer affine and activation function work great with non-linear transformation. Results are boosted to higher dimension.
  • 2. The combination between NN and loss minimisation make backward propagation applicable. Each little step of movements are the result of previous scholars’ research. That makes me feel closely how technologies and theories are developed, and how well statistics and mathematics are applied.
  • 3. Theories are inherited from previous research. Every year and every month, there are researchers from different countries, from different institutions, universities or high-tech firms, publish brilliant papers that are highly shocked and astonishing to further development.
  • 4. The current development of CS or ML are really top-notch and inspiring. Hardware, CPU & GPU & Cloud provide speedy efficiency of calculation, linear algebra works well on the Computer ; algorithms are innovative and update vastly. Hardware and Software together improve the ability of prediction.
  • 5. Although good for predicting, Deep Learning algorithms, NN, is still a Black Box, which means one could not explain the reason of getting the result. The bridge between Input <-> Output are weights, and weights are explained by backward propagation. However, is that pattern true? Is that a Correlation or Causality?

近期经济观察

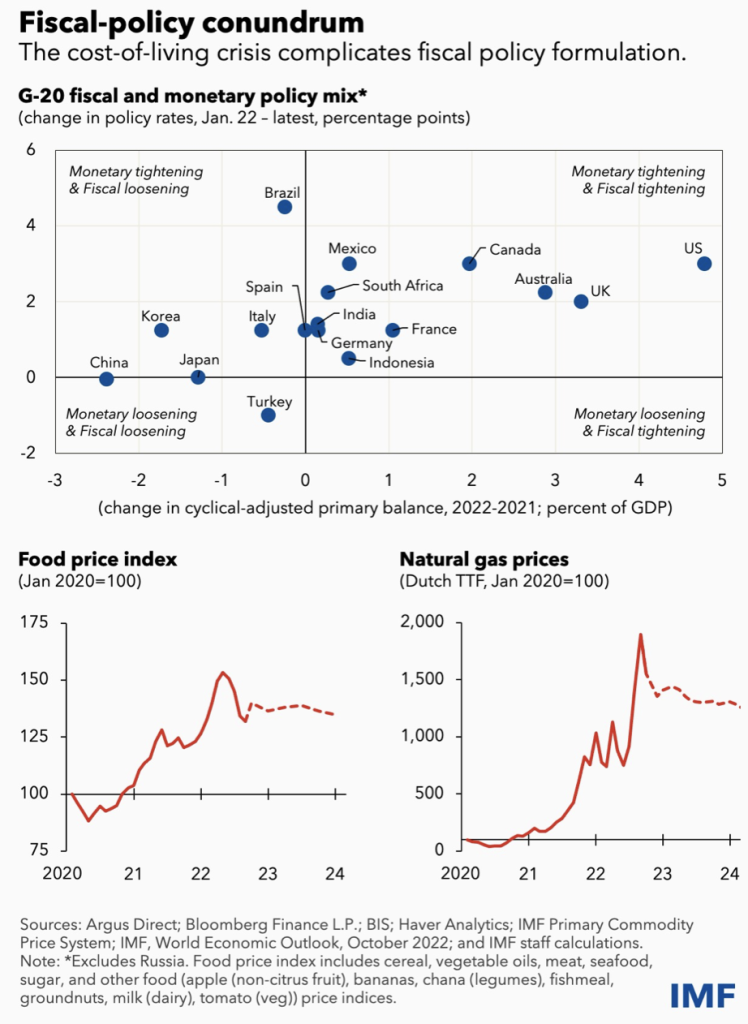
IMF Blog: Policymakers Need Steady Hand as Storm Clouds Gather Over Global Economy, by Pierre-Olivier Gourinchas, illustrated recent facts and economic data. Here is a brief presentation.

The world economic slowdown continues, Growth forecast in China is adjusted downward to 4.4% due to the weakening property sector and continued lockdowns by IMF.

Inflation

Rapidly rising prices, especially of food and the economy are causing serious hardship for households.

Inflation in China seems not that obvious, and the biggest problem, instead, is the slag of econ growth. Fortunately, wages are not increasing that much in most of the world economies. The hyperinflation raised from spikes in prices and wages is under control.

FOMC’s schedule of interest rate increases is expected to slow down, 50bp, in December.

The Chinese government is conducting loosening fiscal policy, stimulating the aggregate demand in part, and increasing the fiscal spending on infrastructure across countries through local financing platforms. The balance sheet is enlarging government leverage rate increases. The strong government is trying to raise confidence in individuals. However, monetary policy is limited due to the QT in the U.S. The exchange rate would be largely damaged if there were CB QE.

Energy Price

Food prices and energy prices surge to a high level and are expected to keep high as IMF expected.

OPEC decreases crude oil supply by 2 million barrer per day. IEA reported that US, as the target of global economic policy, released 15 million barrel of strategic crude oil reserve. US strategic crude oil reserve is about 401 million barrel.

OPEC和US对于石油价格博弈可能要追溯到2020年前,美国页岩油技术在2020年油价暴跌大背景下开始难以盈利。wait for further study.

Strong USD

The strength of USD is a major challenge for many emerging market.

The appropriate response in most emerging and developing countries is to calibrate monetary policy to maintain price stability, while letting exchange rates adjust, conserving valuable foreign exchange reserves for when financial conditions really worsen.

In the tradeoff between the economic growth and the inflation, inflation seems become a piori target. The economy still has a bottom support, rigid demands such as foods, energy, accommodations etc. However, inflation is linked with the nomial term and could be even worsen off.

Diamond and Rajan’s Study about Financial Crisis 2008

The authors noted the financial crisis of 2008 was caused by mainly three reasons.

  1. U.S. financial sectors misallocated resources to real estate.
  2. Commercial and Investment banks had a large proportion of their instruments in their Balance Sheet.
  3. Investments were largely financed with short-term debts.

The following will illustrate why those facts happen.

1. Misallocation of Investment

Step 1. World Crisis pushed up risks.

The financial crisis in emerging markets, East Asia Econ Collapsed, `Russia Defaulted, South America, etc made investors circumspect.

Step 2. Capital Controls made CA surplus.

To react to those unexpected events and prevent domestic industries from the incumbents, governments started to conduct capital controls. Also, investors were unwilling to invest (they cut down investments and even consumptions) or charge a high-level risk premium. A number of countries became net exporters.

Step 3. “dot-com” bubble derived another global crisis.

Those exporters then had a current accounts surplus and transferred the CA surplus into “savings” (investment). Those savings were invested into the high-return business, the IT industry. However, another nightmare happened that is the “dot-com” bubble collapsed around the 2000s.

Step 4. CB QE and US financial innovations made a housing bubble

Central Banks QE, lowered the interest rate, which ignited demand for housing. The house price spiked. In the U.S., financial innovation (securitization) drew more marginal-credit-quality buyers into the market. The crisis manifested itself.

Step 5. Asymmetric information enforced the bubble.

Because rating agencies were at a distance from the homeowner, they could process only hard information. Asymmetric information enforced the bubble. Housing prices surged to prevent “default”.

Step 6. Securitization Iterate itself.

The slicing and dicing through repeated securitization of the original package of mortgages created very complicated securities. The problems in valuing these securities were not obvious when house prices were rising and defaults were few.

But as the house prices stopped rising and defaults started increasing, the valuation of these securities became very complicated.

2. Why Did Bank hold those instruments?

The key answer is bankers thought those securities were worthwhile investments, despite their risks. Risks were vague and unable to be evaluated.

it is very hard, especially in the case of new products, to tell whether a financial manager is generating true excess returns adjusting for risk, or whether the current returns are simply compensation for a risk that has not yet shown itself but that will eventually materialize.

Several facts manifested the problem.

  • 1. Incentive at the Top

CEOs’ performance is evaluated based in part on the earnings they generate relative to their peers. Peer Pressure, which came from holding financial instruments to increase returns, mutually increased the willingness to hold those financial instruments.

  • 2. Flawed Internal Compensation and Control

The top management wants to maximise the long-term bank value and goals. However, many compensation schemes are paid for short-term risk-adjusted performance. The divergency gave managers an incentive to take risks in the short term.

It is not said that the Risk management team is unaware of such incentives. However, they may be unable to fully control them, because tail risks, by the nature, are hard to quantify before they occur.

  • 3. Short-term Debt

Given the complexity of bank risk-taking, and the potential breakdown in internal control processes, investors would have demanded a very high premium for financing the bank long term. By contrast, they would have been far more willing to hold short-term claims on the bank, since that would give them the option to exit — or get a higher premium — if the bank appeared to be getting into trouble.

In good times, short-term debt seems relatively cheap compared to long-term capital and the costs of illiquidity remote. Markets seem to favor a bank capital structure that is heavy on short-term leverage. In bad times, though, the costs of illiquidity seem to be more salient, while risk-averse (and burnt) bankers are unlikely to take on excessive risk. The markets then encourage a capital structure that is heavy on capital.

  • 4. The Crisis Unfolds

Housing Price decreased, => MBS fall in value and becaome hard to price. Balance sheet destorted, and debt level held, and equity shrinked.

Every parties sold out, drived price down again and again.

Panic (no confidence) spreaded worldwide.

Interbank lendings were forzen as inadequate credits.

  • 5. The `Credit Crunch

Banks were reluctant to lend due to two reasons. One possibility is that they worry about borrower credit risks. A second is that they may worry about having enough liquidity of their own, if their creditor demands funds.

  • Dealing with the Crunch

Banks still fear threats from illiquidity. Illiquid assets still compose significant portions of banks and non-banl balance sheets. The price of those illiquid assets fluctuated largely, because liquidty asset could be easily exchanged or sold out for cash, but illiquid assets were unable to do so so that price shrinked and damaged the balance sheet. Debts held constant, but assets shrinked, resulting in shrinkage of equity, and increase in leverage and financial burden.

Coins have two sides. Low prices mean not only insolvent, but also tremendous buying opportunity. The pandic manified the expectation of insolvency, plus illiquid market condition made the fact that less money was availab to buy at the price. Selling iterated itself.

CB standed out, provided liquidty to financial institutes.

However, an interesting thing happened. CB’s intervention to lend against all manner of collateral may not be a unmitigated bless, because it may allow weak entities to continue holding illiquid assets.

Possible ways to reduce the overhand

1. Authorities offer to buy illiquid assets through auctions. `This can reverse a freeze in the market caused by distressed entities. Fair value from the aution can be higher than the prevailing market price. 2. government ensures the stability of financial system that holds illiquid assets through the recapitalization of entities that have a realistic possibility of survival. (我国,纳入国有).

Reference

Diamond, Douglas W. and Rajan, Raghuram G., The Credit Crisis: Conjectures About Causes and Remedies (February 2009). NBER Working Paper No. w14739, Available at SSRN: https://ssrn.com/abstract=1347262

Unemployment Data in the U.S. Labour Market

The statistical data of unemployment rate released last week. 3.5% in September 2022, another lowest level even in history.

The U.S. economy is encountering still hgih level of inflation. To fight the inflation, one of the target of the Fed, the Federal Fund Rate has already been increase to about 3% to 3.25% in order to slow down the economy. However, the unemployment data shows the economy is seemingly continuously heating.

There several reasons explain the over-heated labour market.

  1. Individuals have already overcome the pandemic, and the consumption, especially service, are in high demands. There is even an overshooting of demands for labours.
  2. Many people leave the labour market, and are classified as distressed workers who are not included in the calculation of unemployment rate.
  3. Immigrant policy have changed since the Trump. To increase the employment rate for those “domestic” U.S. citizens, the immigrant policy has been not that friendly. Less low-cost labours inputed into the U.S. economy drives a gap of workers.

The low unemployment rate provides the Fed another inspiration of QT.

After QE

Why QE ?

By QE, the Fed increased the money supply to stimulate the aggregate demand in 2020 and 2021.

$$ Y=C+I+G+NX $$

By QE, more money were dumped into the economy. Two mainly used methods are (1) helicopter drops, and (2) banks/firms repo and CB reverse repo.

What happens after QE ?

  • 1. Individuals got the more money in hands (mainly from Helicopter Drops in 2020) — Consumption increased. In the U.S., people who had SSN and were taxed a year before a certain time point were assured an opportunity of helicopter drops. Those money were highly likely ( and it really is) to transform to real demands in the market, because of the consumption habit in the U.S.

The Fed printed extra money and dumped into the economy. People spent those extra money to buy goods and service. Less Goods and Services were produced domestically in the U.S., while most of them were imported from Mexico, India, Russia, China, Mideast, etc. That is what I discussed before. The U.S. printed money (, which are worthless), and use “nothing” to reap goods and services from all over the world.

The above is one fact. Another is that there are still too much of money in the economy. Too much money chased too little goods. Like Milton Fridman said “Inflation is nothing but a monetary phenomenon”. There were no enough outputs (aggregate supply) to meet the increase in aggregate demand resulted from QE, then inflation surged.

  • 2. Increase in supply of money dragged the interest rate down and thus reduced the financial cost for firms. Investment increased. This case is a bit different. In China, the CB conducted also QE to stimulate the economy especially in the current situation. However, the CB’s conduction is mainly through the Banking System. In this case, money are mainly poured into firms through loans not to individuals. Individuals are hardly able to get low-cost money because on the one hand them may not have enough pledges, and on the other hand people are fear to invest in the real estate, coz the real estate bubbles are in the edge of collapse although the gov is trying to keep the mkt stable.

Pros and Cons are there. Advantages are (1) firms that got the low-cost money are most likely state owned firms. In this case, there are “relative high probability” of safety. (2) firms encounter low financial cost and could have direct impact on infrastructures. Disadvantages are also that (1) money could not be directly given to individuals, no real happiness or utility increase for those family. Family based businesses are still suffering the plunges in demands and undergo bankruptcy. (2) too much money chase too little high-quality assets that can have potential positive expected return or payoffs. Money circulates in the economy, and costs circulates as well to increase. On the one hand there is low efficiency, on the other hand extra money does not contribute to stimulate the economy. Financial System discoodinates.

近期经济观察 – FX rate

USD keeps appreciated after the release of interest rate increase by FOMC on Wednesday last week. The serious attitude from the Fed made the markets adjust their expectation for the interest rate level at the end of this year to be around 4.00% – 4.50% (previous expectation is around 4%). The increase of expectation turned down the equity market in a large percentage.

FX rate becomes also dramatic. The most recent available US dollar index went to be 125 on 16th September 2022. The data after the FOMC will be released this week, and let’s see how the meeting affects the US dollar Index last week.

Clearly, the increase of the USD index is caused by the increase in the US interest rate. USD appreciated are due to not only investors are chasing higher interest rate gains in the US, but also the liquidity gap in USD.

In one of my previous study, I discussed that the Fed keeps QE and QT during the economic cycles to squeeze resources and capitals from all over the world. That results in the magic economic phenomenon in the US currently that high inflation from previous QE and helicopter drops, high interest rate from the Fed, and still very low level of unemployment rate.

  • Could the inflation and high interest rate continue? Maybe Yes.
  • Could the low unemployment rate continue? Maybe No.

China is facing a problem in the domestic market. The gov and CB are struggling with the domestic economy and the foreign exchange. The real estate market seems more vulnerable and more volatile so that CB scarifies the relatively constant FX target, to still hold a low level of interest rate to stimulate investment and domestic mkt.

However, we seem cannot get an obvious react in the short run, the fundamentals still have none improvement. The non-optimistic economic environment reinforces the depreciation of CNY, as I discussed in previous blogs that the growth and prosperity of an economy is another important aspect affecting the FX rate.

Based on above illustrations, I may expect that USD would keep appreciating. Also, the appreciation seems won’t stop if there is not a clear indication of changes in the Fed’s Policy. However, USD appreciation drives capital flowing to the US market, and that is clearly not what every sovereign countries want, because the capital accumulation is moving the US. How could the progress stop? What can we do?

日本和韩国-低生育率的两个模版

经济发展潜力中,不可或缺的就是相对年轻的人口结构,我国的发展模式也是摸着石头过河,参考各个经济体的发展经验,从而试验出最适合我们发展的路线。东亚更是在战后成为全球发展最快的经济区域,其中我国的经济发展还相对靠后一些,最具代表性的是日本、韩国以及新加坡,也是少数跨越中等收入陷阱进入发达国家行列的经济体,日本迅速成为世界第二大经济体,韩国创造了著名的汉江奇迹,并且创造了发展中国经济体在此阶段的增长记录,改开后的很多政策都能看到这些经济体发展时期的影子。人口结构在东亚发展中也比较特殊,经济高增长时期往往是人口结构相对年轻的时候,而深度老龄化与少子化又比其他区域也更严峻,甚至出现了未富先老的问题,日本和韩国对待人口问题的政策差异很大,结果数据上也差异很大,为后来的经济体提供了两个参考模板。

1. 东亚经济奇迹与人口红利

第二次世界大战以后,世界格局洗牌,但东亚依旧很难摆脱贫穷落后的标签,日本虽然具有工业体系,身为法西斯和战败国被美军占领,当时也有戏称麦克阿瑟是日本真正的天皇。东亚之后便集中出现了多个经济体进入高速的发展阶段,其中以体量和增速划分,日本处于经济增长的第一梯队,凭借着工业化水平和出口导向,迅速实现了工业化到民用商品化的转化,全球范围内都能看到日本商品的影子,三四十年的发展便坐上世界第二大经济体的为主。第二梯队则是以韩国、我国台湾、我国香港、新加坡为代表的高增长经济体,俗称为亚洲四小龙,韩国在1965~1989年平均经济增速中,与新加坡共同领衔全球最高的7%的增速,根据70法则,每十年经济翻一番,韩国的经济奇迹也被称为汉江奇迹。第三梯队则是我国大陆、东南亚一些欠发挥国家为代表的经济体。以1965~1989年期间的经济数据,全球经济增长前十的国家和地区,除了瑞士、埃及加拿大以外的七个经济区域都在东亚。年平均增长率超过4%的12个经济区域,东亚占9个,筑起了东亚奇迹。

当然90年代以后,日本韩国纷纷深陷经济金融危机,但东亚奇迹并没有结束,而是一个新的开始,接过高速发展旗帜的则是我们经济体。我国市场经济虽然起步晚,但凭借着综合优势,比如基础工业化既有苏联老大哥的协助,又有中美蜜月期美国的协助,结合巨大的高性价比人口红利释放,尤其是60后婴儿潮、80后婴儿潮。快速的坐稳世界第一大制造业产能国、稳居世界第二大经济体以及世界第一大进出口国,超过韩国创造的7%发展奇迹,改革开放后维持了40年平均9.7%的增速,单独支撑了一个经济奇迹,至于最近十几年跟着玩金融信贷扩张,透支经济未来以及政策推高的资产泡沫,那是另外一个故事了,十几亿人温饱脱贫是举世无双的经济成就。

结合东亚人口稠密,资源有限,竞争激烈,可能还有传统文化的影响,盛产高性价比劳动力,这对任何资本都是一座金山,对内可以支撑发展的原始积累,对外是吸引国际资本和产业的筹码,资本都是逐利的。不管是我国、日本、韩国,经济高速增长时期都离不开一个支撑,那就是相对年轻的人口结构,我国的62年以后每年约2500万的婴儿潮,韩国1955~1963年的710万婴儿潮,日本的战后和平时期3年超过800万的婴儿潮,之后都成为了经济发展的重要力量,现在也被称为人口红利。人口结构相对年轻,10个人8个劳动力,与10个人4个劳动力,经济发展潜力当然不同。有人总说我国人口多,不需要鼓励生育,典型的只看体量不看结构,消耗的人大于产出的人,压力都到了后来者头上,结果就是恶性循环。

日本与韩国人口问题的政策差异

高速的工业化,城镇化以及平均受教育水平都会降低人口出生率,但根据全球的发展趋势,这三项都很难逆转。政策干预生育率往往只能让生育率下降减速,最好的结果是稳住不继续下降,而这些政策的核心是增加公共服务,以及宏观资源向年轻群体倾斜。

我们先回顾一下日本模式,核心政府不断增加负债来维持社会的公共服务支出,进而弥补企业和居民部门信贷和消费收缩带来的问题,当然这种公共服务也包括对生育环节的扶持。这个趋势是从90年代日本资产泡沫破裂以后开始的,日本模式的好处是经济不至于崩地彻底,也并没有出现更大范围的失业和金融停摆。代价则是居高不下的政府负债率,政府杠杆主要经济体中独树一帜,美国经常提高政府负债上限至今也是望尘莫及。

之后还有了所谓的安倍经济学,其三板斧分别是:更宽松的货币政策、更灵活的财政政策以及结构性改革。前两个比较突出,但并没有新的东西,安倍经济学是把日本模式玩到了极致,用更快速的给政府加杠杆的方式,再配合灵活的财政政策给市场输血,刺激经济热度,尤其是给居民输血,经济状况好坏都需要维持居民的公共福利开销。当然代价也是非常明显的,安培经济学把兴奋剂翻一倍,效果立竿见影但持续时间很短,之后又恢复到了极低增长和负利率之中,更快速的积累了尾大不掉的政府杠杆,让后来日本货币政策几乎失去了选择的余地,只能在无限宽松中一条路走到黑,美联储加息周期中,美元兑日元一年不到的十年站上140的位置,日元一年不到的时间贬值25%。

日本政府加杠杆减低居民压力的方式,隐藏的一个利好数据则是总和生育率,90年代资产泡沫破裂前后的总和生育率在1.5左右,截止2021年的数据,日本的综合生育率为1.34,三十年降低了约0.16的程度。此外,日本还是全球人均寿命最高的经济体,这也验证了一个结论,虽然日本模式代价很大,但毕竟玩了三十年。既然做不动分配改革,政府加杠杆总好过迫使居民加杠杆。日本模式只要还能维系一天,这种公共服务和生育率预计就还能维持一天,直至日本模式玩崩为止,或者说,即使日本模式今天崩溃,那不也续了30年的命么,居民享受了三十年的高公共服务,人生也没有几个三十年,很难说不值。

而韩国则是另一个发达国家的极端,以10%左右的公共福利占GDP的比重在发达国家中稳坐倒数第一的宝座,对内要喂饱财阀势力,对外要喂饱国际资本。以前政府只需要与财阀斗争,97年亚洲金融危机放开了外资控股,现在的三星现代等大企业都有大量的外资控股,财阀和国际资本形成利益捆绑,让本就没有军事主权的国家,根本无法对这些既得利益者下手,强人如文在寅也并没有触及这些分利集团的核心,世袭罔替的大小财阀根据推算可以占到韩国GDP的9成以上,预计不是和平方式可以撼动的。

居民看不到希望,高压下也没有讨价还价的资本,这种经济发展更多的是钝刀杀人。既没有暴力,也没有明面的掠夺,但就是中下层逐渐成为财阀和买办利益的牺牲品。居民部门负债占GDP比值超过100%,也是2008年全球金融危机之后独一档的存在。虽然韩国公共福利占GDP的比重逐年增加,却依旧维持在10%水平。相比于经合组织的其他发达国家的30%左右仍有巨大的差异,常年处于垫底的水平。既得利益者对居民的高压掠夺,且极其吝啬的公平服务,不仅是世界上第一个突破1的经济体。还在不断的刷新着自己的记录,2021年更是把世界的下限拉低到0.81,成为全球和平时期最可能把自己民族搞绝种的经济体。

总结起来:东亚奇迹有他的进步性,但也有很多问题,依靠人口红利和快速的工业化崛起,也必将因为工业化后,人口红利老去进入深度的老龄化。日本模式和韩国模式,必将成为东亚其他后来发展经济体必要摸的石头,这里都可以归入到系列文章提到的上中下三策:上策分配改革,调节财富结构,出清既得利益者;中策政府部门负债维持公共支出,保障居民的社会福利和生活质量;下策则是把成本都压到居民头上,居民不断加杠杆为各个环节提供利益。

日本模式可以归入到中策,韩国模式则可以近似归入到下策。之所以用近似,是因为韩国模式也未必是坏的结果,韩国分配再烂,也已经进入了高收入国家行列,有大量的高附加值市场占比。东亚的其他经济体如果再不提前做分配改革计划的上策,又不愿意政府负债来维持公共支出和居民福利,一味的给居民加杠杆来加剧财富结构畸形的下策,结果只会比韩国更惨,更低的生育率,深度老龄化后的老无所依问题,社会的僵化和阶层固化,都将是不可抗拒但又可以预期的结果。

Ref

文章全文摘自王克单出处:https://mp.weixin.qq.com/s/7d21-hVYi2a3KyllR44o9Q

财务造假分析 – 大坑

财务造假的动机

  1. 避免ST
  2. 有融资需求,让报表好看
  3. 完成业绩对赌协议
  4. 个人利益

造假的手段

  1. 虚增收入 by 虚构客户 供应商,循环交易
  2. 虚增收入 by 无中生有,遭假合同 流水
  3. 虚增收入 by 提前确认收入(权责发生制 提前确认)
  4. 虚减费用 by 删除账目。 导致lia和exp同减少
  5. 虚减费用 by 会计政策变更,coz 不计提坏账等
  6. 虚减费用 by 跨周期确认费用 以调整利润

识别

  • 1. Gross Profit Margin

通过虚增利润、虚减费用等方法会造成 Gross Profit Margin陡增。因为Rev 虚增时 COGS不变;同理COGS虚减时, Rev不变 ==> 导致GPM陡增。

因此GPM跨时间周期中大幅波动;GPM 显著高于同业 等情况需要引起重视。

  • 2. Inventory Turnover 与 经营情况不符。

正常企业经营,Rev COGS高是由于卖货多,所以 Inv Turnover 增加,意味着企业运营能力提高,会带来 Rev COGS提高,会带来 NI提高。

但是,若Inv Turnover 减少,同时Rev增加,需要引起重视。有可能是企业,虚增业务导致Rev增加,而实际并未有业务发生,所以Inv不变,所以Inv Turnover不变。

  • 3. CF表

CFO与NI的关系。 若NI常年未能转化成Cash,说明企业有巨多A/R,此部分A/R很可能是虚增的:Dr. A/R; Cr.Rev 为了虚增Rev。

  • 4. Others

如企业账上有巨多Cash,还要融资。等不正常行为。

Reference