1.Big Debt and Debt Monetisation, Particularly in the World’s Leading Reserve Currency.
Debts Were Raised in the Crisis but were unable to be ended after. The CB, thus, print money to repay those debts.
2.Internal Conflicts over Wealth and Values Gaps
3.The Rise of a Great Power (China) to Challenge the Existing Great Power (US) and Existing World Order, Leading to External Conflicts.
Eight Factors are used to evaluate the movement of dominant countries: Education Innovation and Tech, Competitiveness, Output, Trade, Military, and Monetary.
Q&A
中国需要管理跨境资本流动以避免风险 & 同时要担忧金融制裁,所以加速数字货币,放在被进行贸易制裁。
世纪经济金融与全球秩序的展望
林毅夫 – 新结构经济学:新兴经济市场 – 后入者优势(copy paste),而previous dominant需要持续发展创新以维护it’s dominant place。Or battle through the other way, such as the military. 中国需要保持:1. 开放的态度 <– 作为全球化的推动者 (继续保持8%左右的增长,占全球GDP增长量的1/4,助力全球经济的发展)中国的增长会是其他(非美国)国家的机会;2. 动态的经济发展、避免战争风险希望历史进程以和平的方式推进,但是参考历史,战争的风险很大。
The Fed increase the federal fund rate and resulting in an increase in the nominal interest rate in the U.S. market. The U.S. dollar becomes more and more attractive to global investors due to mainly two reasons. One is that the U.S. dollar behaves as the safety currency (detailed reasonings are shown in the previous posts), and the other is that the increase in the interest rate attracts money from other countries to be invested in the U.S. market.
U.S. dollar gets appreciated for the above two reasons, and thus the U.S. faces an increase in trade deficits. For the aggregate U.S. market, imports are way more than exports. However, those extra imports are clearly paid through the U.S. dollar or exchanged with other currencies (but shared with the same logic as paid with USD). And that extra amount of US dollar is from the helicopter drops and QE of the Fed. That means the extra US dollars back with nothing, but are used to purchase/import assets from other countries. Right! it do not need to be backed by other in the current economy (Also, MMT advocates even crazy).
I am telling that those facts are equivalent to that the U.S. is getting net imports from other countries for free. Also, the U.S. is sending its “worthless” extra currency to others, exchanging goods and services. Productions are not working in a good way for those exporting countries in the battle with the pandemic.
Due to the fact that the US dollar is the safest currency, the extra printed amount is absorbed by other countries that get net exports to the U.S. Those other countries export goods and services and import back inflation. There are also countries that conduct QE in a similar rhythm to the U.S. would face even higher inflation intuitively, because the US dollar is the safest one and the only one linked with crude oil and commonly accepted in commodities trading but other countries’ currencies are not.
Fed放水,释放美元供给,按quantity theory of money的说法:people hoard money instead of spending them。但是现实中, hyperinflation comes later than the theory tells。原因可以部分可以参考MMT。同时美元作为 1. 最safest的货币,且 2. 与石油挂钩,并未大宗商品交易的主要媒介,仍然有很大的需求。导致虽然市场上美元供给增加了,但是因为紧张的国际关系、俄乌战争、de-globalisation、pandemic的影响,以及上述两条原因,市场上对美元仍有大量需求,导致inflation没有立刻到来。
但是,大量printed US dollar实际上并没有real goods\ productions or services的支持,很多出口商品的他国公司获得美元(or other currencies, but similar as holding USD)交付(美国import,其他国家export),这里的美元只能用来交易且为extra美元。相当于是Fed pays nothing印的钱,买了real goods。这些出口国家失去了商品、产能、and factors,得到了USD,相当于得到了nothing but inflation,由美国extra money printed 带来的 inflation。
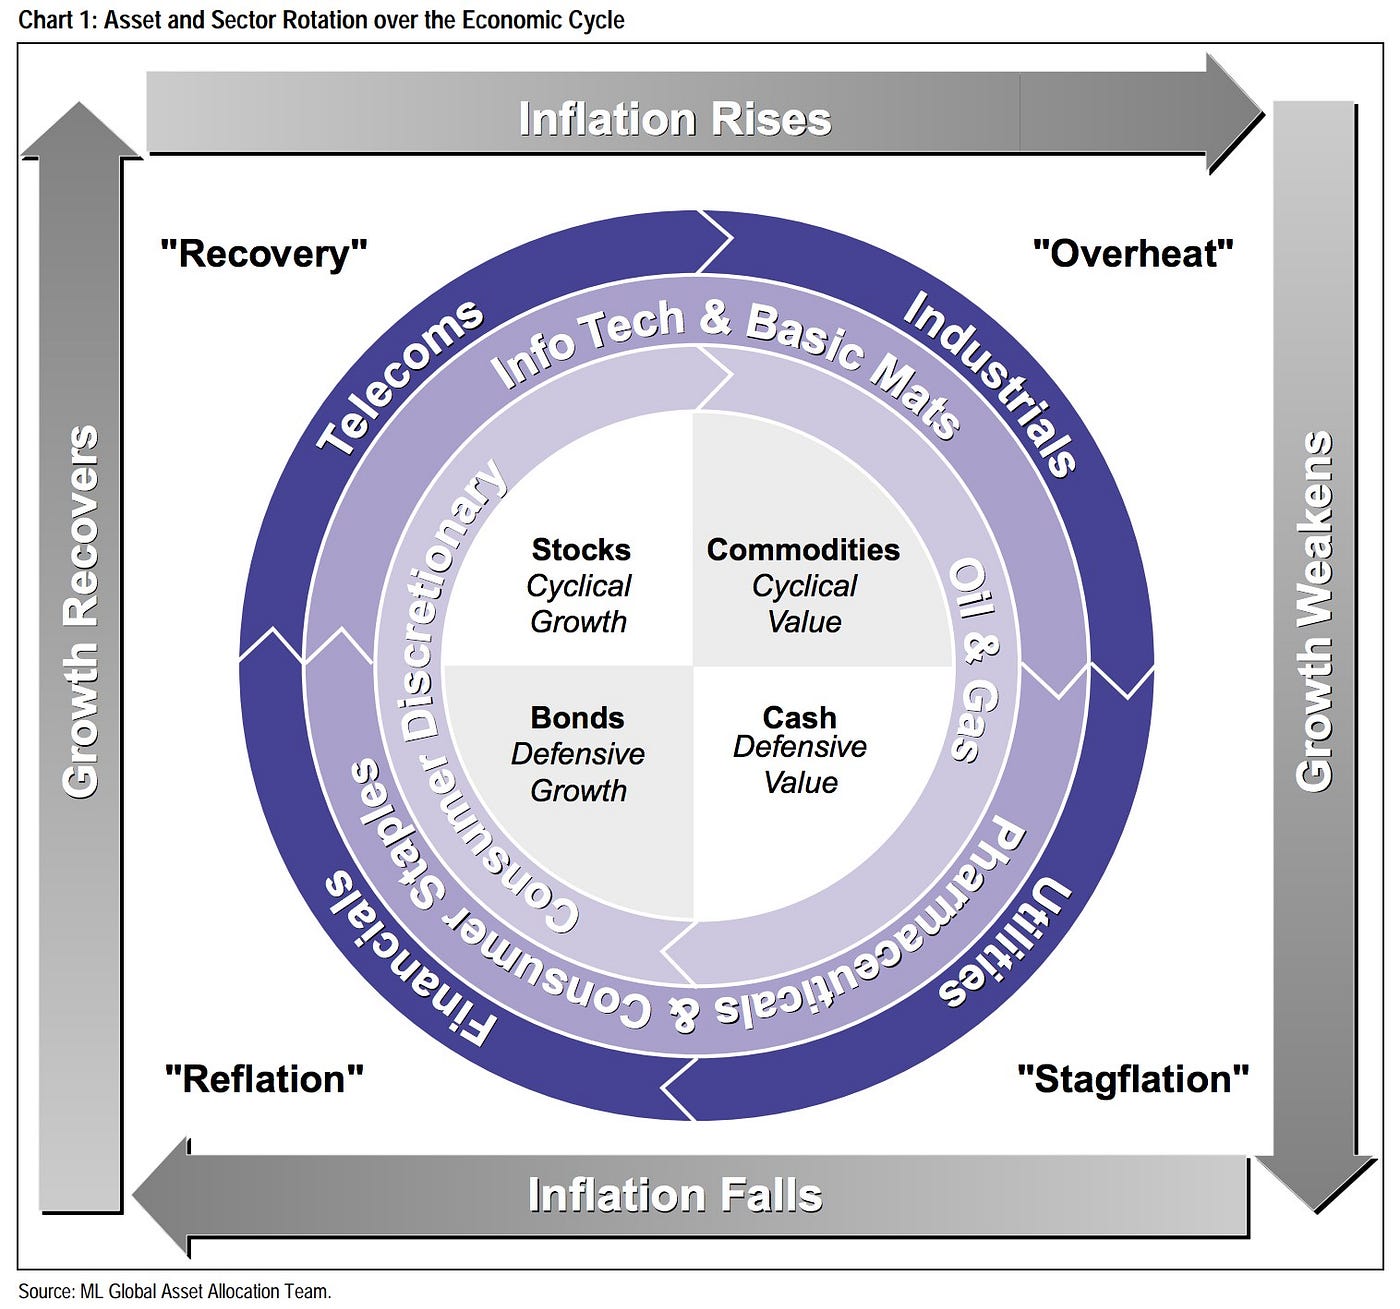
The Merrill Lynch Investment Clocks describe a framework for understanding the business cycle.
The Merrill Lynch clock separates the business cycle into four phases.Each phase is comprised of the direction of growth and inflation relative to their trends.
1. Reflation – 萧条
After stagflation, people are frustrated and have low confidence in investing.
Both the GDP growth and inflation are falling or lower than the trend. The stocks are suffering in a bear market but bonds suppose to be the most welcomed asset because of the generous monetary and fiscal support from governments and central banks (bail-out, cutting rates, and stimulus programs).
Jan 2020 till Apr 2020, the pandemic flowed globally. Governments of each country conducted policies of lockdowns. The economy was blocked, and the unemployment rate increased. A recession began globally.
Low Growth and Low Inflation
Bonds are attractive
2. Recovery – 复苏
Investors’ confidence has built up / recovered.
Growth starts to back on track while inflation still remains low. Stocks regain attraction with very attractive valuation and improving earnings. It is, of course, the most favorable asset at this stage.
From May 2020 to Feb 2021, the Central Banks and Fiscal Divisions of each country placed monetary policies and fiscal policies, aiming to boost the economy. A huge amount of money was pooled into the market. QE and Helicopter Drops were conducted and resulted in an increase of M2, about 10% in the European market, and 25.7% in the U.S. Meanwhile, the interest rate hit the floor. Banks with extra money reserves holding started to actively search for clients with the demand for money.
The good thing is money went to the market and smoothed the economy. The recession gets reversed a little bit. However, bad things happened at the same time that (1). individuals and firms held extra money. That fact raised people’s expectation of inflation, and thus invested their extra holding of money into stock markets, pushing an increase in the index; (2). Firms with not good financial and operating conditions were also granted credits and debts. Potential default probabilities increased.
High Growth, and Low Inflation (but expected inflation increased)
Stocks are attractive.
P.S. Bitcoins are even more attractive, coz the limited supply and even more sensitive than stocks.
3. Overheat
Growth reaches its peak and slows down and inflation is rising. (does it sound familiar if you follow these days’ headlines?) Both stocks and bonds won’t perform well, but betting on commodities will be a proliferating and profitable strategy.
The economy got overheated, and the economy was still speedily moving until reaching a peak. After achieving the top, growth got slower.
The expected inflation in the recovery stage transferred to a true increase in inflation with high CPI. Investors started to be unconfident and started to pursue safety assets, which are necessities such as commodities (metals and crude oil).
High Growth and High Inflation.
Commodities are attractive.
4. Stagflation
Inflation is way out of control and that severely hurts consumer confidence. Central banks are forced to hike rates, and stocks, as one of the leading indicators of the economy, have already fallen. However, this stage of the cycle doesn’t happen that often in the last few decades, thanks to Fed’s “remarkable” economic interference policy, which is to print out enormous money to stimulate the economy meanwhile artificially setting interest rates low to control the inflation (however we just don’t know how long it could last). Flying to safety assets, cash is the best choice given the circumstance.
The Fed’s policy works not bad because the U.S. dollar links with crude oil, and becomes one of the “safety assets”. However, other countries do not have that “lucky” chance.
Low Growth and High Inflation.
Even the U.S. Dollar is not safe enough, so people change to hold cash.
We decompose a time series into two parts, one is the trend, and the other is the seasonality.
$$ y_t=g_t+c_t $$
, where \(g_t\) is the trend, and \(c_t\) represents seasonality. Or, one can understand those two components as a low-frequent part, and a high-frequent part.
We can see the first term represents how far the trend term \(g\) is away from the original series \(y\), and the second term means to smooth the trend term \(g\).
P.S. Considering the interest rate and saving, lower real interest rates motivate individuals to consume more and save less. Greater consumption enhances capital/money transferring in the whole economy. We may say that a lower interest rate can not just stimulate the economy in a positive way through increase the desire for investment and consumption, but also smooth the economy by pooling liquidity into the market.
Under Globalization, money flows across countries with low fees and less regulation. Without considering others, money would flow into the market with a higher interest rate, pursuing higher returns. However, sovereign risks, frictions, regulations, etc, would block that path. 在全球化的大背景下,如果假设低fees低监管等限制,money会流入高收益的市场。但是现实中往往并非如此,因为投资者会考虑其他因素,如地缘风险,政策变化等等。
继续之前的例子, C国利率高,money流入C国,对于C国currency的需求大,currency appreciates。C国货币升值后,A国再进口C国商品物料或投资的成本变高。对C国货币的需求又会相对减少。Overall, a Dynamic Equilibrium occurred.
Factors affecting stocks valuation are liquidity of the market, Prosperity of the overall market, investors’ preference, etc.
In simply the DCF model, the impacts of those factors would be reflected in the discounted rate. As we consider separating the interest rate into a risk-free rate and the premium for a certain firm, the premium is idiosyncratic. For example, with low liquidity of the capital market, investors would expect a liquidity premium; worse economic conditions and low investors’ preferences would increase the risk premium.
Therefore, we could predict that an increase in the federal fund rate, as what the Fed is doing to face the hyper-inflation, and quantitive tightening would have the following impacts. Firstly, the quantitive tightening (QT) or TAPER means the Fed would actively decrease its balance sheet by sell-out/stoping re-issuing those MBS or Government debts. This conduction would decrease the amount of money available in the market, and thus result in higher costs of borrowing money. The liquidity premium would increase. Secondly, if there is less supply of money, then the higher cost of using money, the interest rate, would increase. Both the increase in the interest rate and the premium would increase the discount rate for a certain company. Applying the higher discounted rate to the DCF model for that firm would end up with a lower valuation.
Conclusively, an increase in the Federal Fund Rate and QT/TAPER would generally result in a lower valuation of firms.
$$ \triangle P \approx \frac{dP}{dY}\triangle Y+\frac{d^2P}{dY^2}\frac{(\triangle Y)^2}{2!}+O((\triangle Y)^3) $$
Devided by P from both side, then the LHS means the percentage change of Price.
$$\frac{ \triangle P}{P} \approx \frac{dP}{dY}\triangle Y \frac{1}{P}+\frac{d^2P}{dY^2}\frac{(\triangle Y)^2}{2!}\frac{1}{P}+O((\triangle Y)^3) $$
By definition, the Modified Duration \( D=\frac{\triangle P / P}{\triangle Y} = \frac{dP}{dY}\frac{1}{P}\), and convexity \( C=\frac{d^2 P}{d Y^2}\frac{1}{P} \). We replace them into the expansion function. and drop the last term.
$$\% \triangle P \approx D\cdot \triangle Y+\frac{C}{2}\cdot (\triangle Y)^2$$
Finally, we get the approximated bond price curve. Second order Taylor Expansion is applied, and the Duration and Convexity, two important properties of bonds are included. For more accurate approximation, more terms need to be expanded.
Developed by John B. Taylor – aims to be a rule of thumb
If the Federal Reserve decides to increase the liquidity, it would then buy bonds and put more money into the market. As there is more money to lend, the interest rate would go down.
The monetary policy aims to target the inflation rate. Considering the Philips curve, there is a trade-off between unemployment and inflation. Unemployment could be replaced by its counterpart, economic growth. We consider the goal of the monetary department to balance GDP and Inflation.
The Fed normally has a target interest rate, the federal funds rate, which is the overnight rate in the interbank market for short term lending. How should the monetary policy set the target interest rate? This is the key discussion of the Taylor rule.
$$i=i^*+a (\pi – \pi^*) – b(U-U^*)$$
By the Philips curve, we replace unemployment with output. As we separate the interest rate to be the real interest rate and the inflation rate.
The output gap could be considered to be by what percentage of the current GDP is below the Potential GDP.
Clearly, the Taylor rule is intuitively to be correct.
If there is an inflation gap the current inflation is greater than the target, which also means there is an extra money supply moving the CPI upward, then the Fed should conduct a contractionary monetary policy, and it should set a higher interest rate.
If the GDP growth is lower than the target (potential), or if the unemployment rate is greater than the target, then the Fed would like to stimulate the market. Thus, it would decrease the interest rate.
For the Taylor rule, John Taylor did not mean the monetary policy should follow it. It is not a law but just a rule of thumb. Normally, we also set the coefficients \(a\) and \(b\) to be 1\2. However, if we think the government would pay more attention to the inflation target, then we could certainly increase the weight of inflation gap.
The story began in the third quarter of 2012 when the Japanese Yen depreciated until the beginning of 2013 as the rising Blue curve shows.
As we all know, Japan has been getting into a negative interest era for a long time, partially because the terrible economic condition makes its government have to raise debts (I haven’t studied the Japanese problem. Once do that, I will update it.).
Since 2008 when the US saved the market through QE, the Japanese CB chose to conduct a similar monetary policy to boost its domestic market after Aben won the presidency.
Intuitively, Abenconomics applied QE would result in an excess supply of the Japanese Yen. Unlike the US dollar that backed with the Oil price, the excess money supply of the Japanese Yen would make it depreciate. Soros estimated that opportunity and shorted the Yen, and meanwhile took a long position of Nikkei stocks and bonds in the Japan Market.
QE would result in an extra money supply as we all know, investors who get that extra money would try to invest that money into the financial market, both the stock market and the debt market. As we can find that stock market increased with the depreciation of the Japanese Yen. Soros won the gamble.
However, there is a Winner and there must be a loser, which is the Japanese Central Bank. The failure of the monetary policy of the Japanese CB made worse its domestic economic condition.
In the current world, the CB of each country has to rigorously implement its monetary policy. QE might not be an ideal way to stimulate the market, because not every currency has the ability, like the US dollar, to back up with commodities and oil prices. Also, countries especially those that are in the EU are facing a conflict of interest in conducting monetary policy.